🗓 Detect inequity in penalties for low-level infractions
Why it matters: Millions of people face arrest for non-criminal violations
Millions of people face arrest warrants from minor, non-criminal citations.
Insufficient data has made it hard to understand the concentration or fairness of who faces such legal risk. In fact, it's hard to even know the true number of people affected.
Arrest from minor citation
When drivers are stopped for a traffic violation, or homeowners are cited for an unkempt lawn or broken sidewalk, or people are ticketed for loitering or other minor offenses, they are written a municipal citation and levied a fine of up to several hundred dollars. To collect on these tickets, municipal courts issue arrest warrants against individuals with outstanding fines. People who were unable to pay initial fines are subject to escalating costs and legal penalties. They may face time in jail. These penalties criminalize poverty and ensnare people with limited means in with escalating financial burden and legal risks.
The Supreme Court’s faulty reasoning adds legal risk
But because the problem is unmeasured, it can be minimized and ignored in ways that further punish those affected
In Utah v. Streiff (2015) the U.S. Supreme Court held that if a police officer illegally stops someone, then discovers that person has an outstanding warrant, the stopped individual can be subject to arrest and search. (This weakened longstanding precedent that safeguarded individuals’ Fourth Amendment rights against unconstitutional policing by marking evidence collected following an illegal police stop as “fruit of the poisonous tree” that could not be admitted in court.) The Supreme Court majority reasoned that a encountering an individual with an outstanding warrant was an “extraordinary” (pdf) circumstance. In a blistering dissent, Justice Sotomayor argued that rampant overpolicing meant such warrants were not extraordinary, but in fact troublingly common in many communities.
Yet, neither the majority nor the dissenting justices had complete data to measure how common such outstanding warrants are and how many people are affected.
Getting the hard-to-get data
This project used unusually available data from Austin, TX to find the prevalence and concentrations of individuals facing arrest stemming from minor municipal citations.
What I found:
- This project was able to collect full records of individuals in Austin, TX who have outstanding warrants stemming from municipal citations
- There are more than 20,000 such individuals in Austin
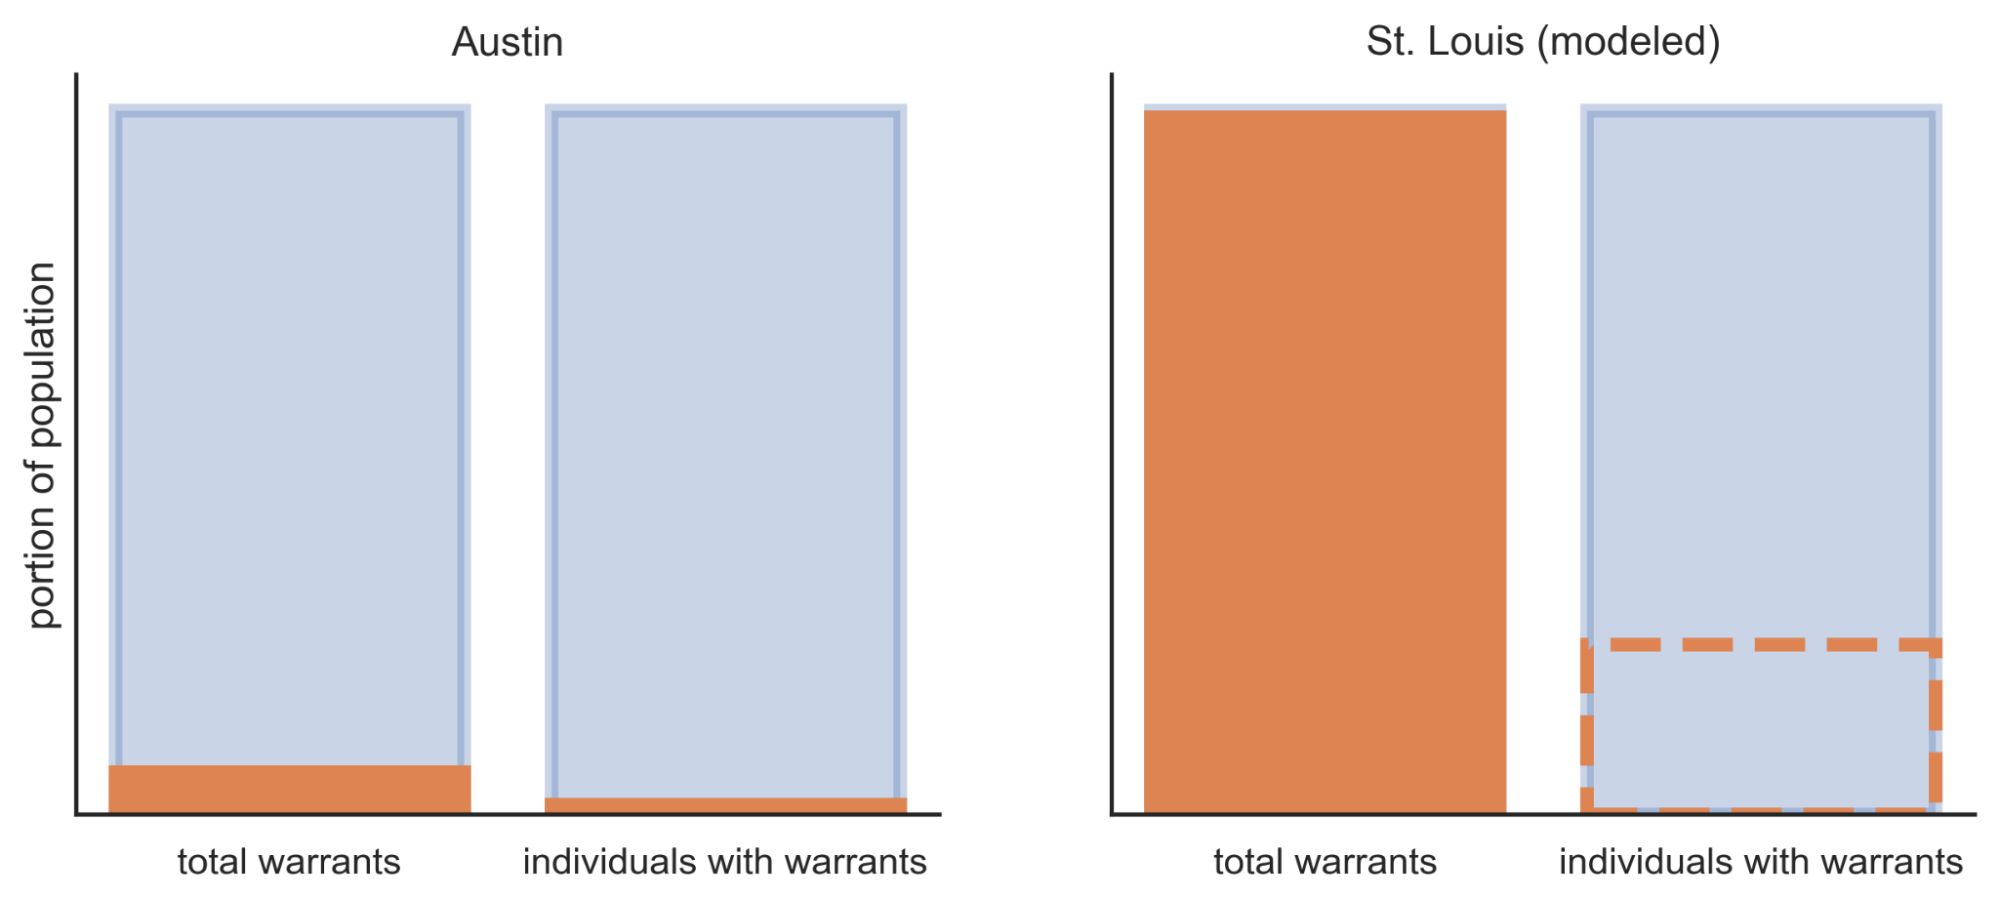
- Compared to some other jurisdictions, Austin has relatively few outstanding warrants. If the distribution of warrants is the same in St. Louis (where it has been shown there are many more outstanding warrants), 22 percent of the population there faces a warrant from a municipal citation.
- There are correlations between the areas with home to more individuals with outstanding warrants and areas with larger Hispanic or Latino populations, as well as areas with lower median incomes.
- The number of Hispanic or Latino individuals, the number of households receiving SNAP benefits, plus controlling for the number of police stops and for neighborhood effects, can explain about 70 percent of the variation in the number of warrants.
- This model suggests that each for additional 33 Hispanic or Latino residents or each additional 7 households receiving SNAP benefits in a Census Tract, there is one additional individual facing a warrant
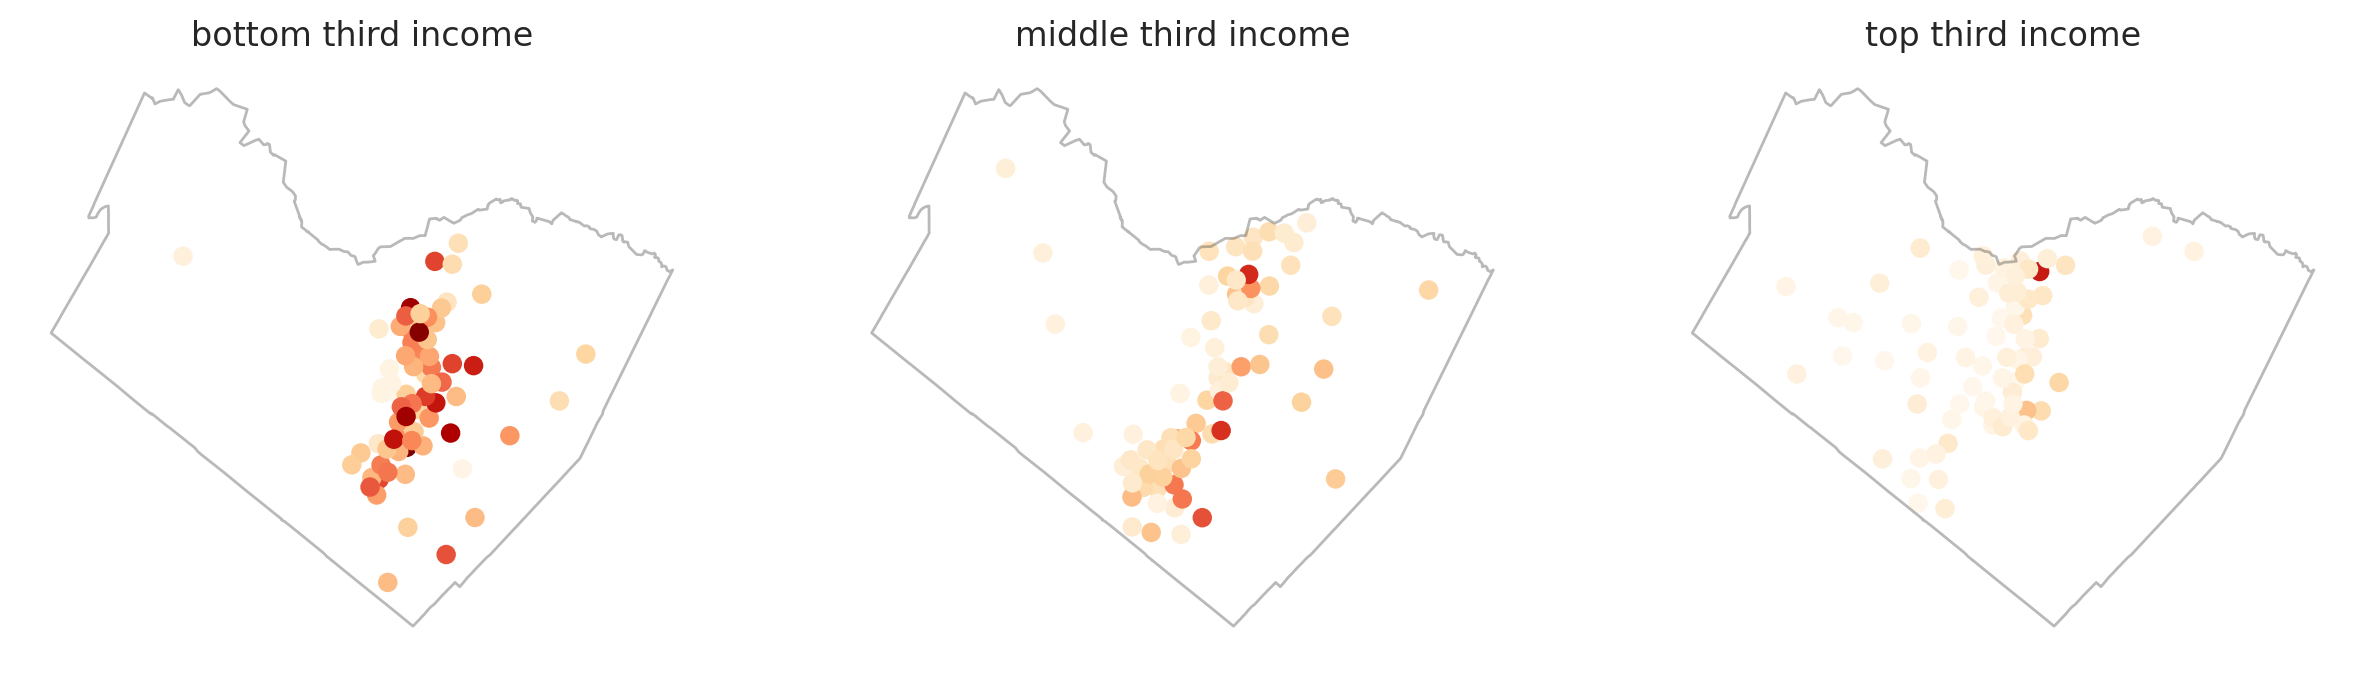
- The spatial patterns of warrant assignment are fundamentally different among high-, medium-, and low-income neighborhoods. There is (perhaps unsurprisingly) little variation among high-income neighborhoods, there is much more variation in warrant prevalence across low-income neighborhoods.
- Looking specifically at the local density of warrants, there is a underlying spatial similarity in high-income neighborhoods, but, surprisingly, little spatial similarity among low-income neighborhoods. This means, generally, that the concentrations of warrants in low-income neighborhoods are driven by unique, very local factors and not by a more diffuse condition across a larger area or side of town.
How I did it:
It’s a long story! For the full details (footnotes and all), check out the full technical reports covering the project background and fairness analysis and the spatial and geostatistical analysis (pdf).
Here are the basic steps:
getting the data
Data on this topic are difficult to collect. Municipal court records are unique to each city and town and are rarely made publicly available in any form.
Unusually, the police department and municipal court in Austin, TX post searchable databases listing individuals who face warrants.
By scraping the police department’s data for all individuals with outstanding warrants, then using those names to search the municipal court database, we were able to pull a complete list of individuals, their outstanding warrant debt, and case histories.
Thanks to my collaborator Branden for identifying the data sources then scripting a clever and kind web scraper that could parse the municipal databases without DDoS'ing them.
geocoding and spatializing
The municipal court data includes abbreviated addresses with the name of the street, city, state, and ZIP code (in most instances as a 9-digit ZIP + 4). Thus the exact location can't be determined—perhaps for privacy reasons—but the location can be approximated within a reasonably small area.
I looked around for crosswalk files to locate ZIP + 4, but these are not available from USPS and were prohibitively costly from private data vendors. I instead used ArcGIS World Geocoding Service to geocode addresses and this was able to match 87 percent of records to an individual street segment. I then manually reviewed addresses that matched to other (coarser) locations and kept only those that had correctly matched to a point of interest in Austin. Finally, I filtered the data to only those locations within Travis County (the county Austin sits within).
exploratory analysis
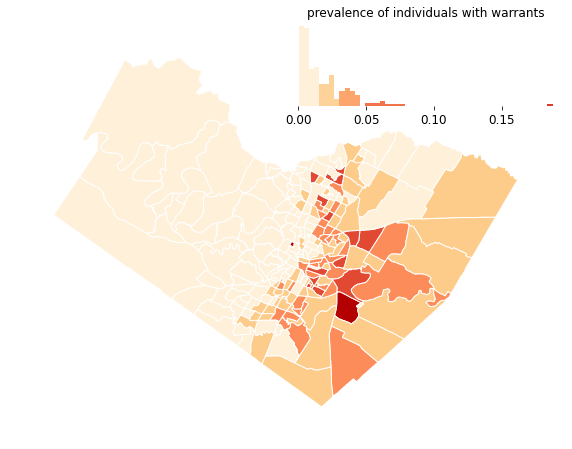
I summed the number of individuals with outstanding warrants within each Census Tract, and divided by the total population to compute the warrant prevalence. I also summed the total outstanding citation balance in each Census Tract. I then compared these measures to various indicators of demographics and socio-economic status.
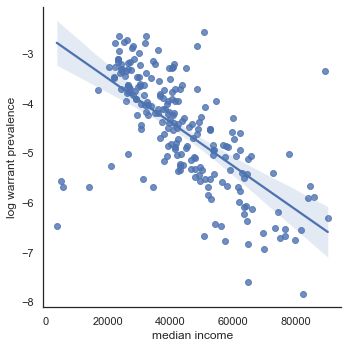
The strongest demographic indicators of warrant prevalence were indicators of area income and the Hispanic or Latino population. Spatially-lagged linear regression of the log of warrant prevalence rate by tract median income, the best-fitting model, showed an R2 score of 0.45.
The total number count of Latino or Hispanic residents in a Census Tract also correlated linearly with the prevalence of warrants. The spatially lagged regression showed an R2 fit of 0.44. This suggests that the number of Hispanic or Latino residents in in a neighborhood explains nearly half the variation in the warrant prevalence.
spatially-adjusted regression analysis
Exploratory analysis like this often ignores the potentially confounding effect of underlying spatial patterns. In order to account for spatial autocorrelation, I computed spatial lags (the mean value at all other Tract locations, weighted by the inverse distance from the location) and added these to the regression models.
I further refined the model by controlling for the number of police traffic stops within each Census Tract.
A linear model based on the Hispanic or Latino population, the number of households receiving SNAP benefits, the number of police stops, and the neighborhood effects shows R2 of 0.70.
Based on the coefficients in this linear model, each for additional 33 Hispanic or Latino residents or each additional 7 households receiving SNAP benefits in a Census Tract, there is one additional individual facing a warrant, controlling for the the number of police stops.
semivariance
Semivariance is a measure of the spatial structure of data by showing over what distance (range) the relationship between data points is affected by their proximity. Beyond the range, data values are independent of one another, but within the range, there is an underlying spatial pattern or effect that influences the measured values.
By splitting the data between income groups and comparing the measured semivariance, I could test whether the patterns or structure of warrant assignment were different on different income-level neighborhoods.
density
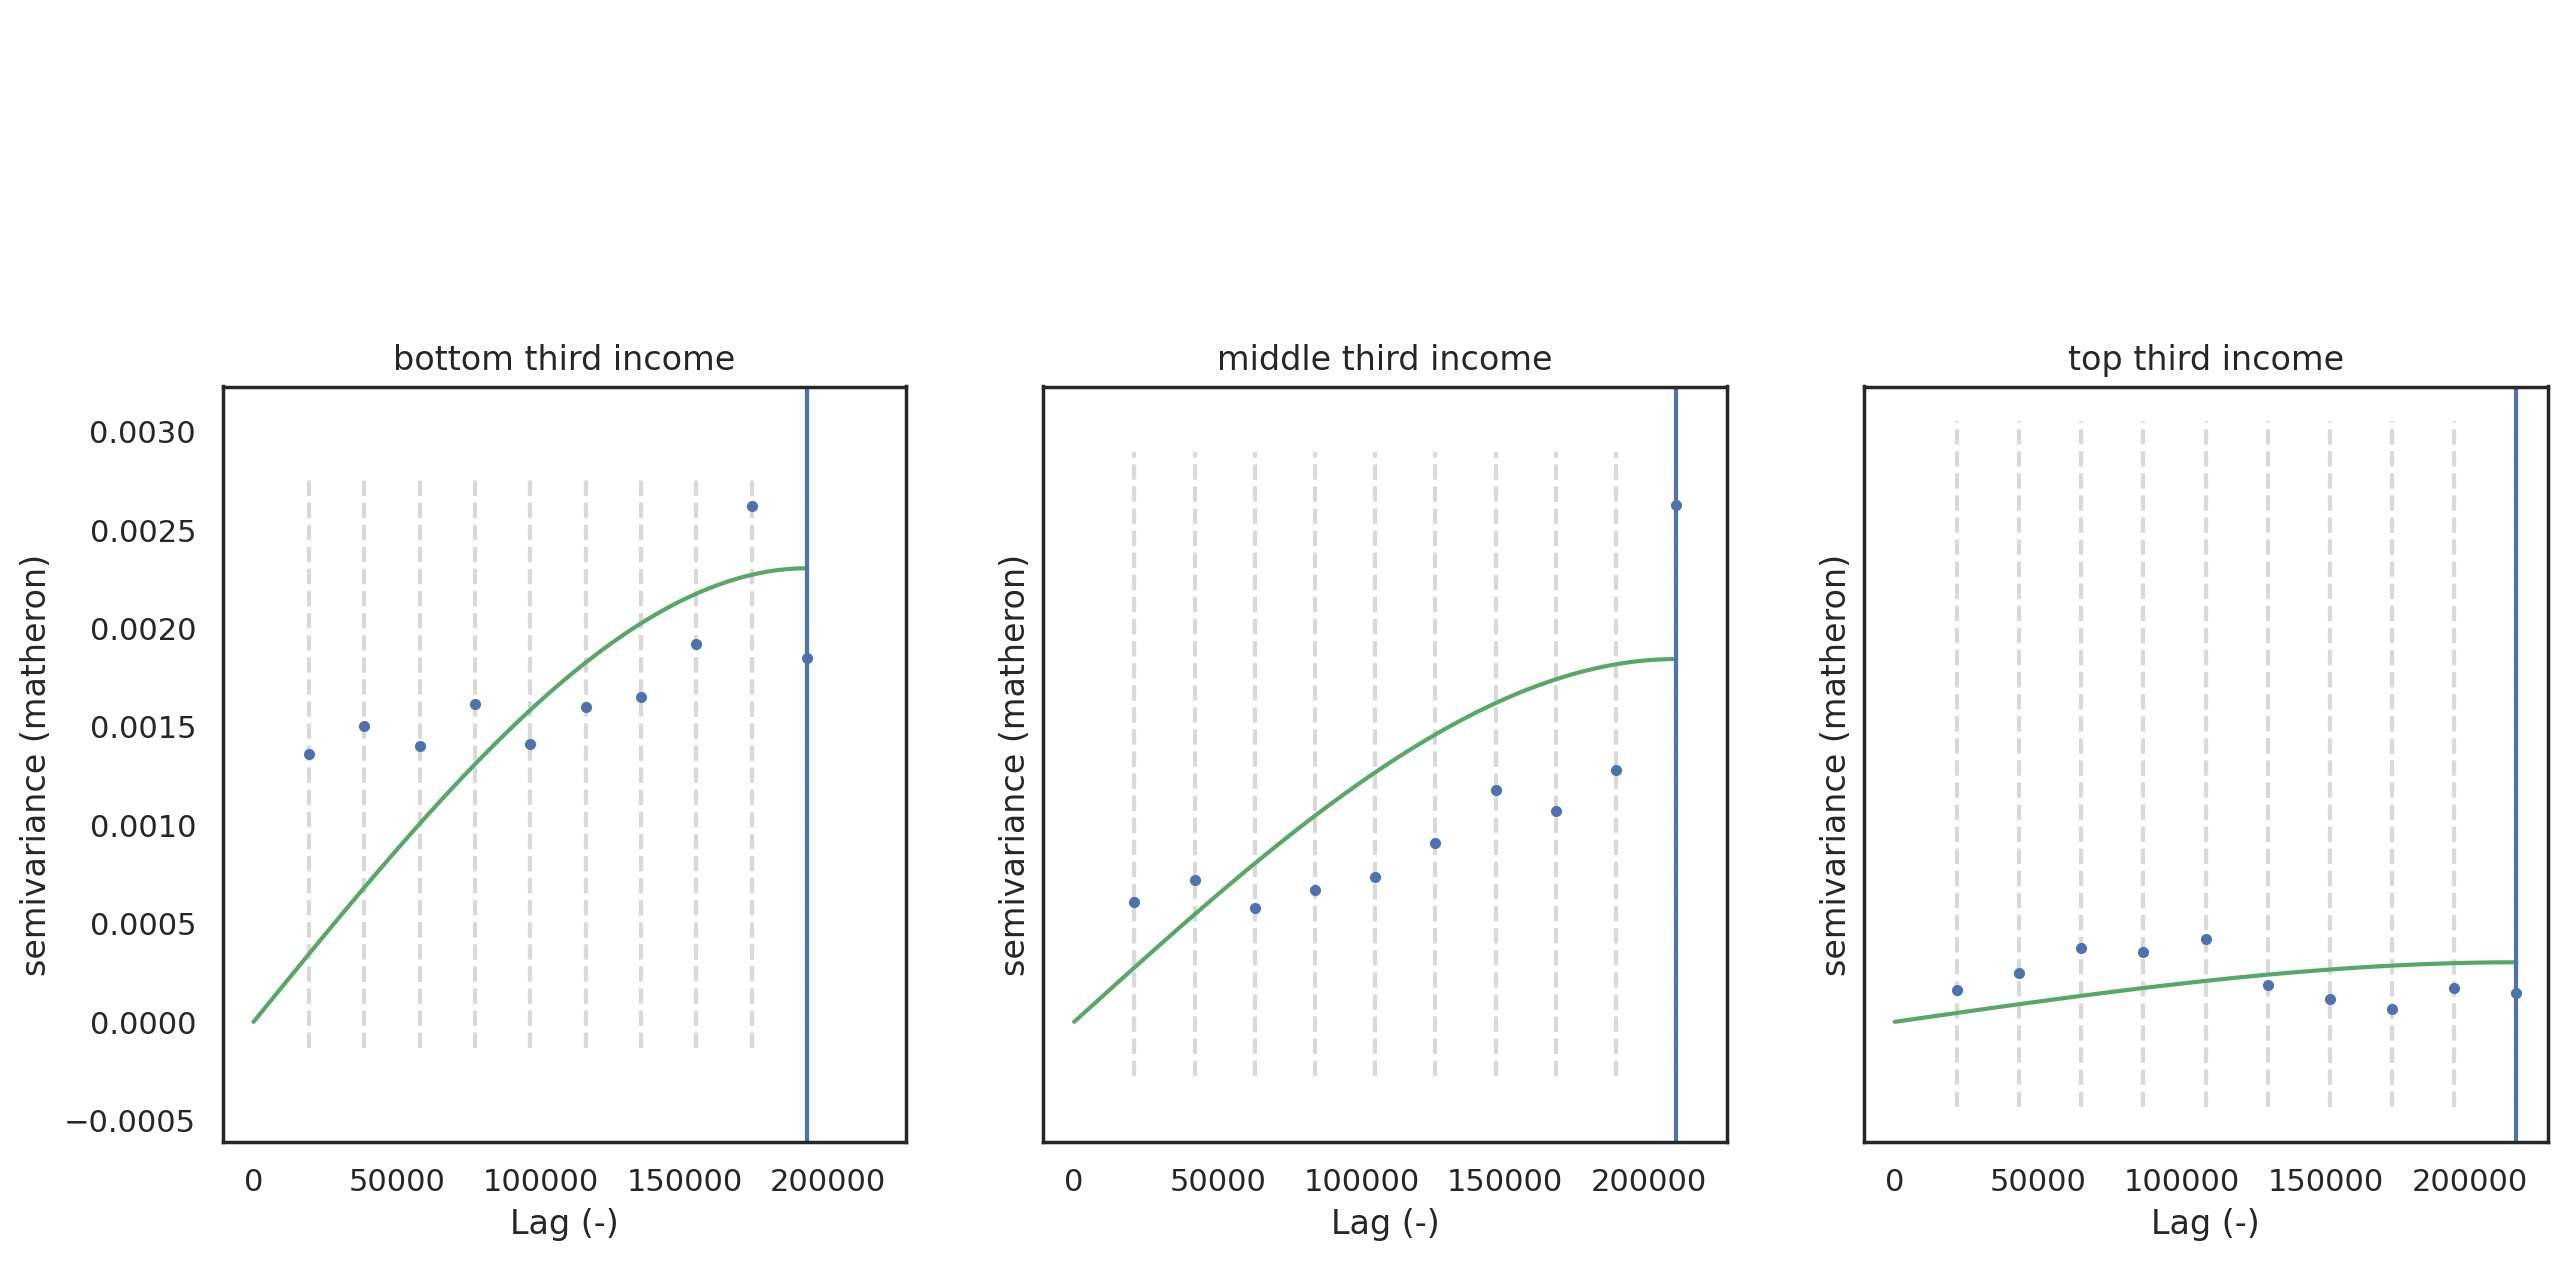
I first tested the semivariance of the density of individuals with outstanding warrants.
I overlaid a regular hexagonal grid over Travis County (using the Uber-designed H3 bins applied with tobler ). (Hexagons are great because, compared to squares, they have less variance in distance between edge and centoid, and each centroid has six, equidistant neighbors.)
I summed the individuals with warrants within each hex bin (because the bins are equal in area, the sum is also the relative density), ascribed the median income of the Census Tract in which the bin centroid sat to the bin, split the bins into three quantiles based on median income, then computed the semivariance for each income quantile.
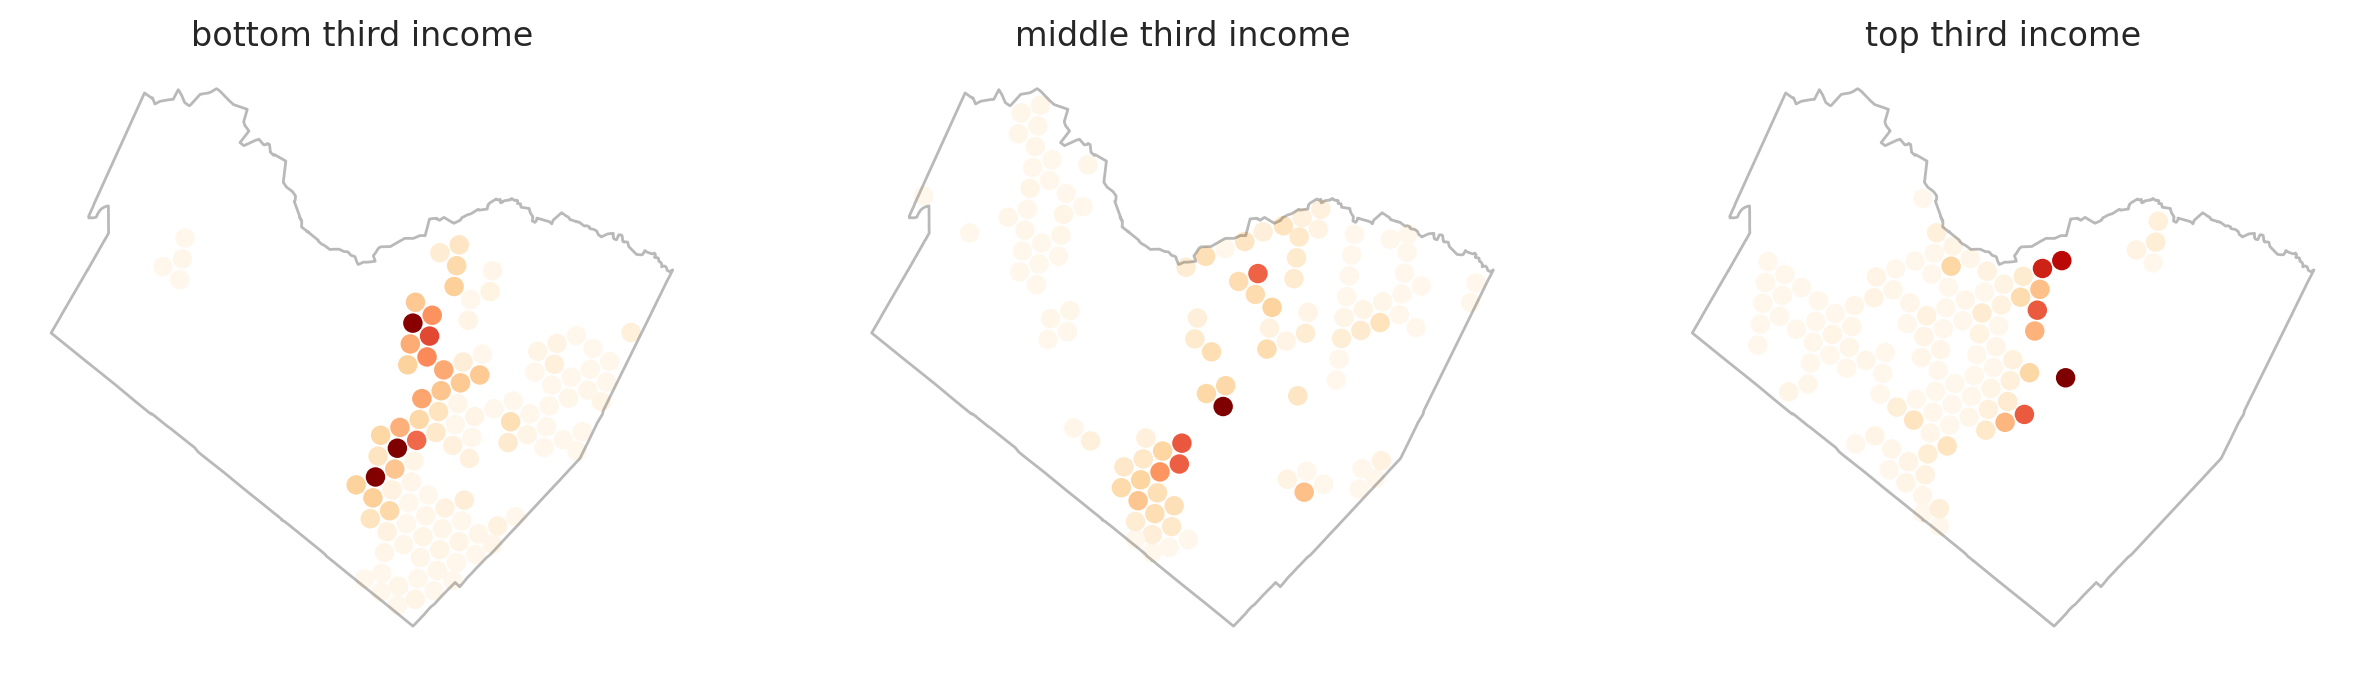
The lowest income group shows a much higher semivariance and the narrowest range. Comparatively, the middle- and top-third income groups show much lower semivariance overall. The middle income group has a slightly wider range than the bottom income group. The range for the highest income is much greater than the others.
This suggests that among these lower income areas, there is a higher variation in warrant distribution: that is, the dissimilarity in the allocation of warrants between neighbors or between neighboring areas is greater. In contrast, the higher income groups show more similarity across greater distance, suggesting a more similar underlying mechanism of warrant assignment.
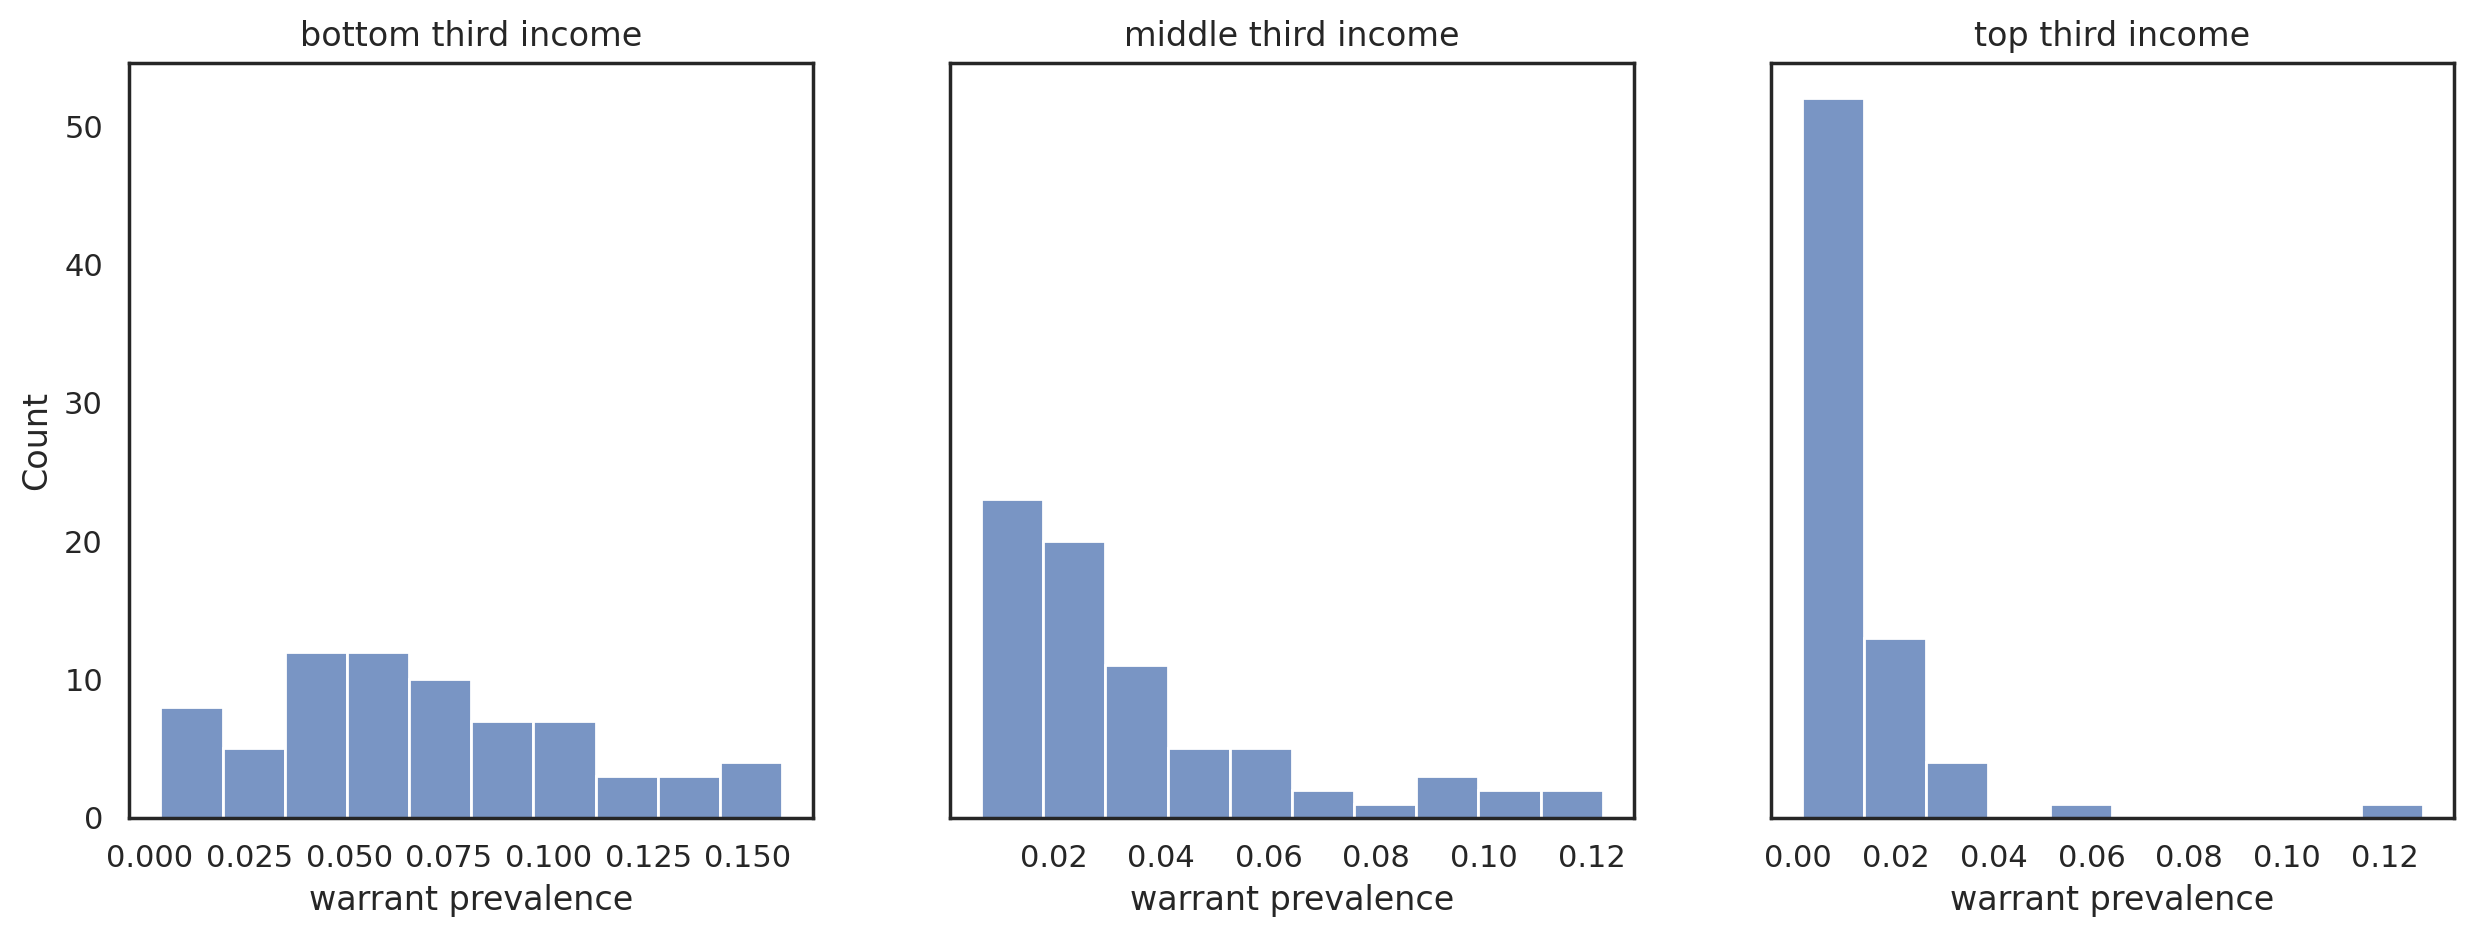
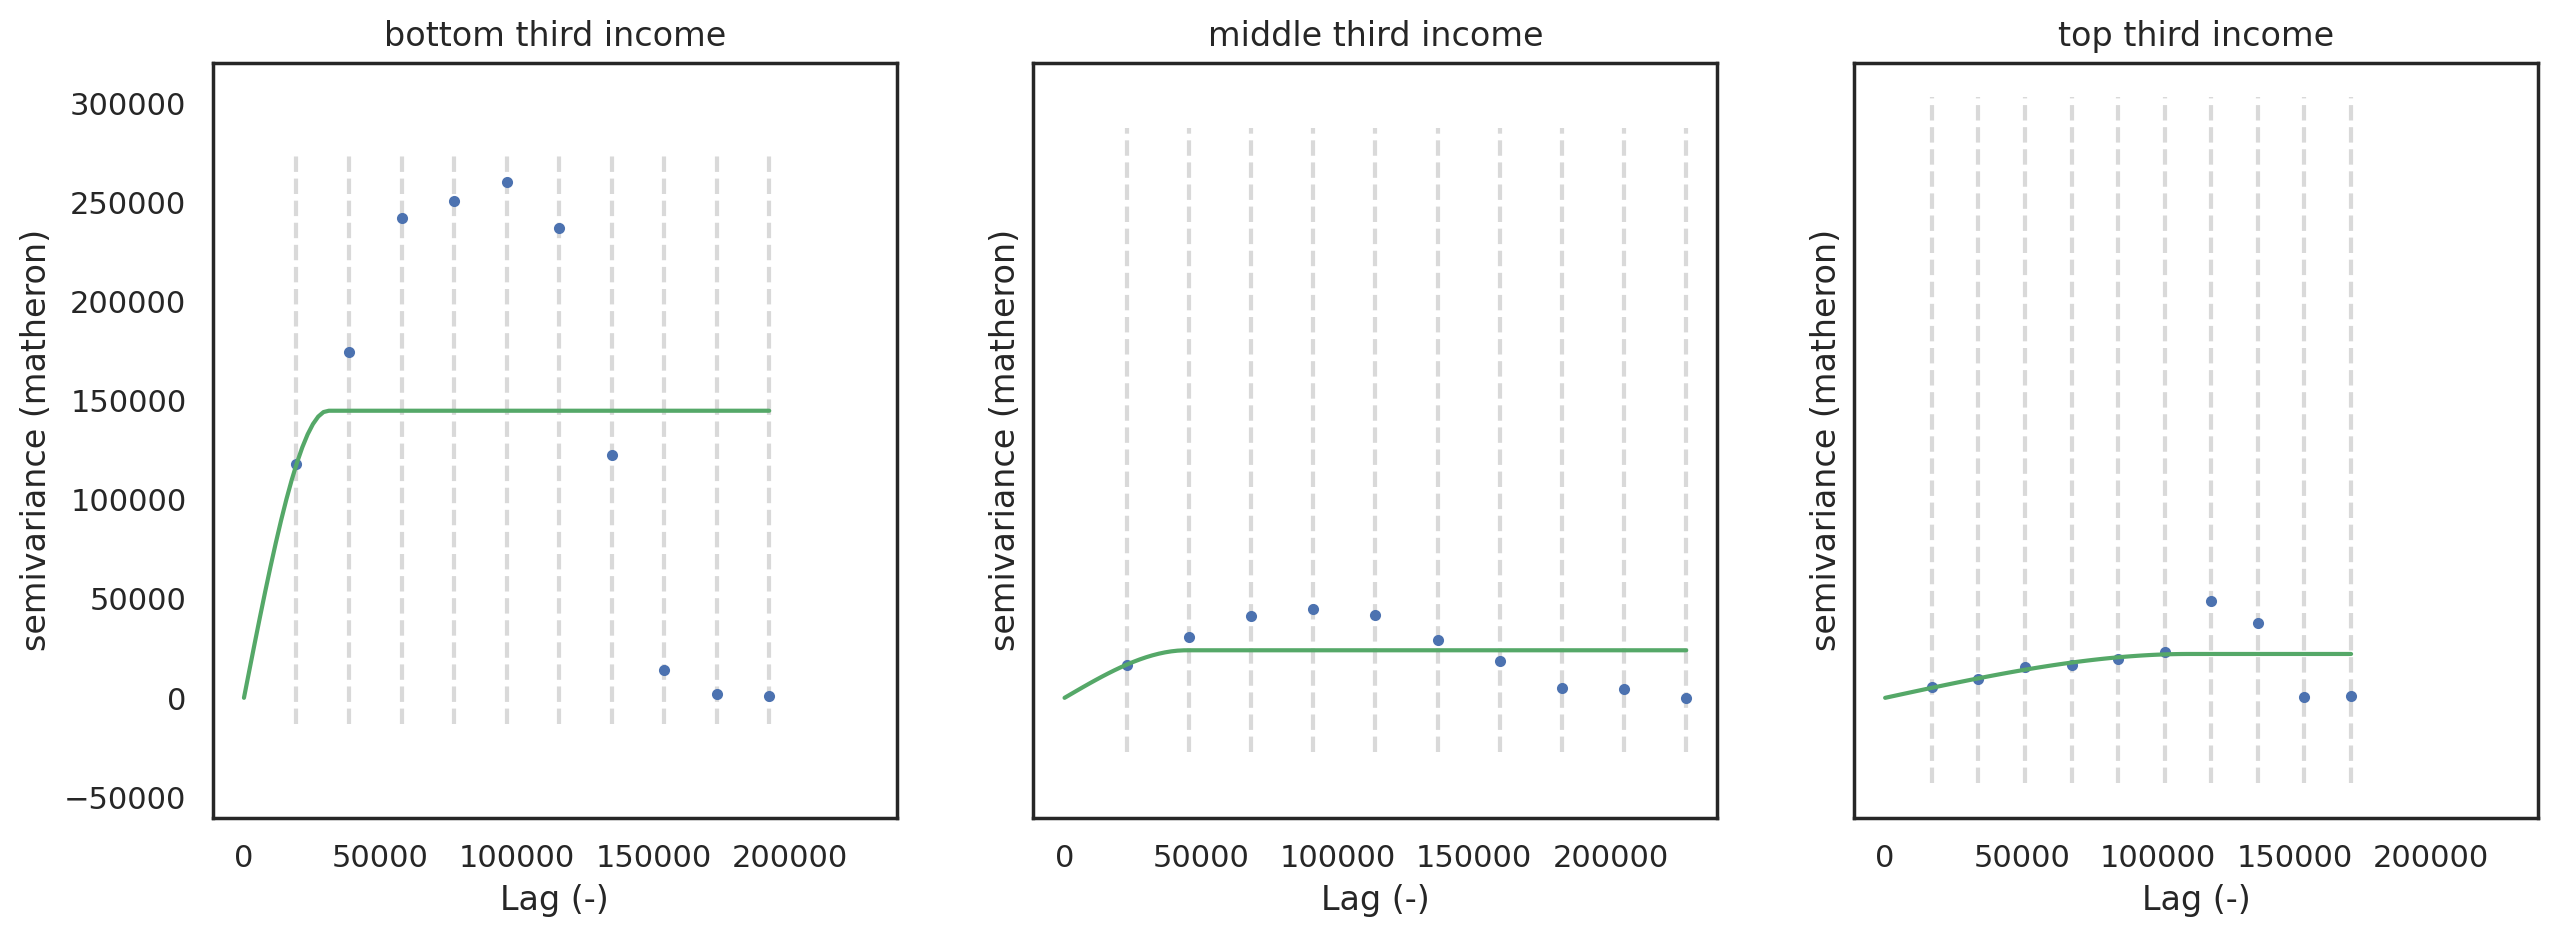
prevalence
The pattern of the density of warrants could simply represent the overall population density, so I recomputed the semivariance based on the prevalence of individuals with outstanding warrants to compare.
I tool the prevalence by Census Tract, computed above, split Tracts into three income quantiles, then computed the semivariance of prevalence between Tract centroids.
As before, the variance is much higher within the lowest income group, again suggesting more variation in the assignment of warrants across low-income neighborhoods. The high-income group has the lowest variance, the middle-income group sits evenly between the other two.
The distribution of warrant prevalence rates within each income group reinforces this pattern. The lowest-income group shows nearly equal counts of Tracts with prevalence between 0 and 0.175; the middle-income group has a greater concentration of tracts with rates near zero; and at the highest income, nearly all tracts have a rate near zero.
Whereas the semivariance across hex bins showed a very steep curve and short effective range (especially for the lowest-income set), the Tract, warrant prevalence semivariograms each show variance increasing continuously with distance and register effective range only at the outer limit of the study area. This is true for each income group. This indicates that Tracts are spatially related to one another across any distance; there is no point at which the variation in warrant prevalence is independent of an underlying spatial process. It may also indicate that once accounting for base population the pattern of warrant assignment is similar across a wide area and not as locally-driven.
tools I used:
- Python data science and spatial analysis tools:
geopandas: managing spatial datasklearn: fitting regression modelslibpysal: spatial weights; spatial lagsesda: testing spatial autocorrelation; computing local indicators of spatial associationskgstat: computing semivariance and plotting semivariogramsmgwr: fitting geographically-weighted regressionmatplotlib,geoplot,seaborn: maps and visualizationscenpy: pulling Census data and geographies from API
- ArcMap World Geocoding Service