🍃 Measure inequity in tree canopy change
Challenge
Extreme heat is one of the most dangerous weather events and an increasing threat under climate change. Tree cover provides shade and absorbs heat, blunting some of the effects of the ‘urban heat island.’ New York City’s MillionTrees campaign added trees citywide.
Did new tree cover reach the neighborhoods with the greatest vulnerability to extreme heat?
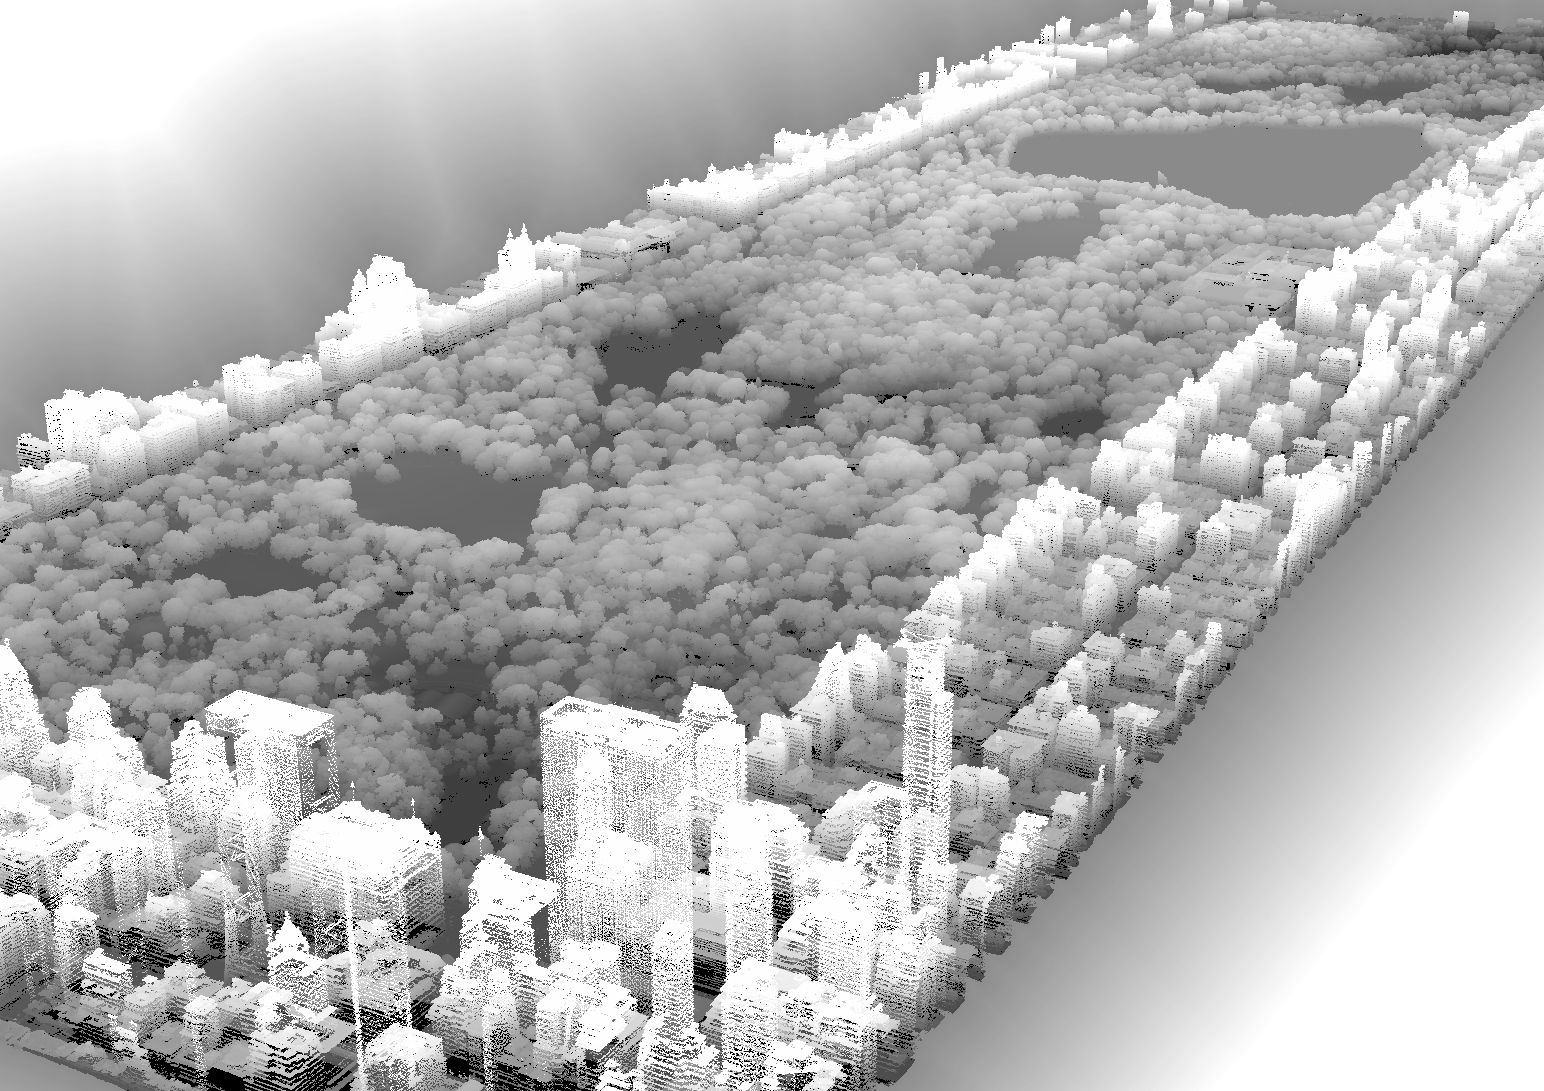
Using high resolution LiDAR-sourced tree cover data, this project assessed whether the changes in tree cover were equitable.
By mapping and modeling local tree gain (or loss) against neighborhood demographics, the study found trends and local outliers.
Insights
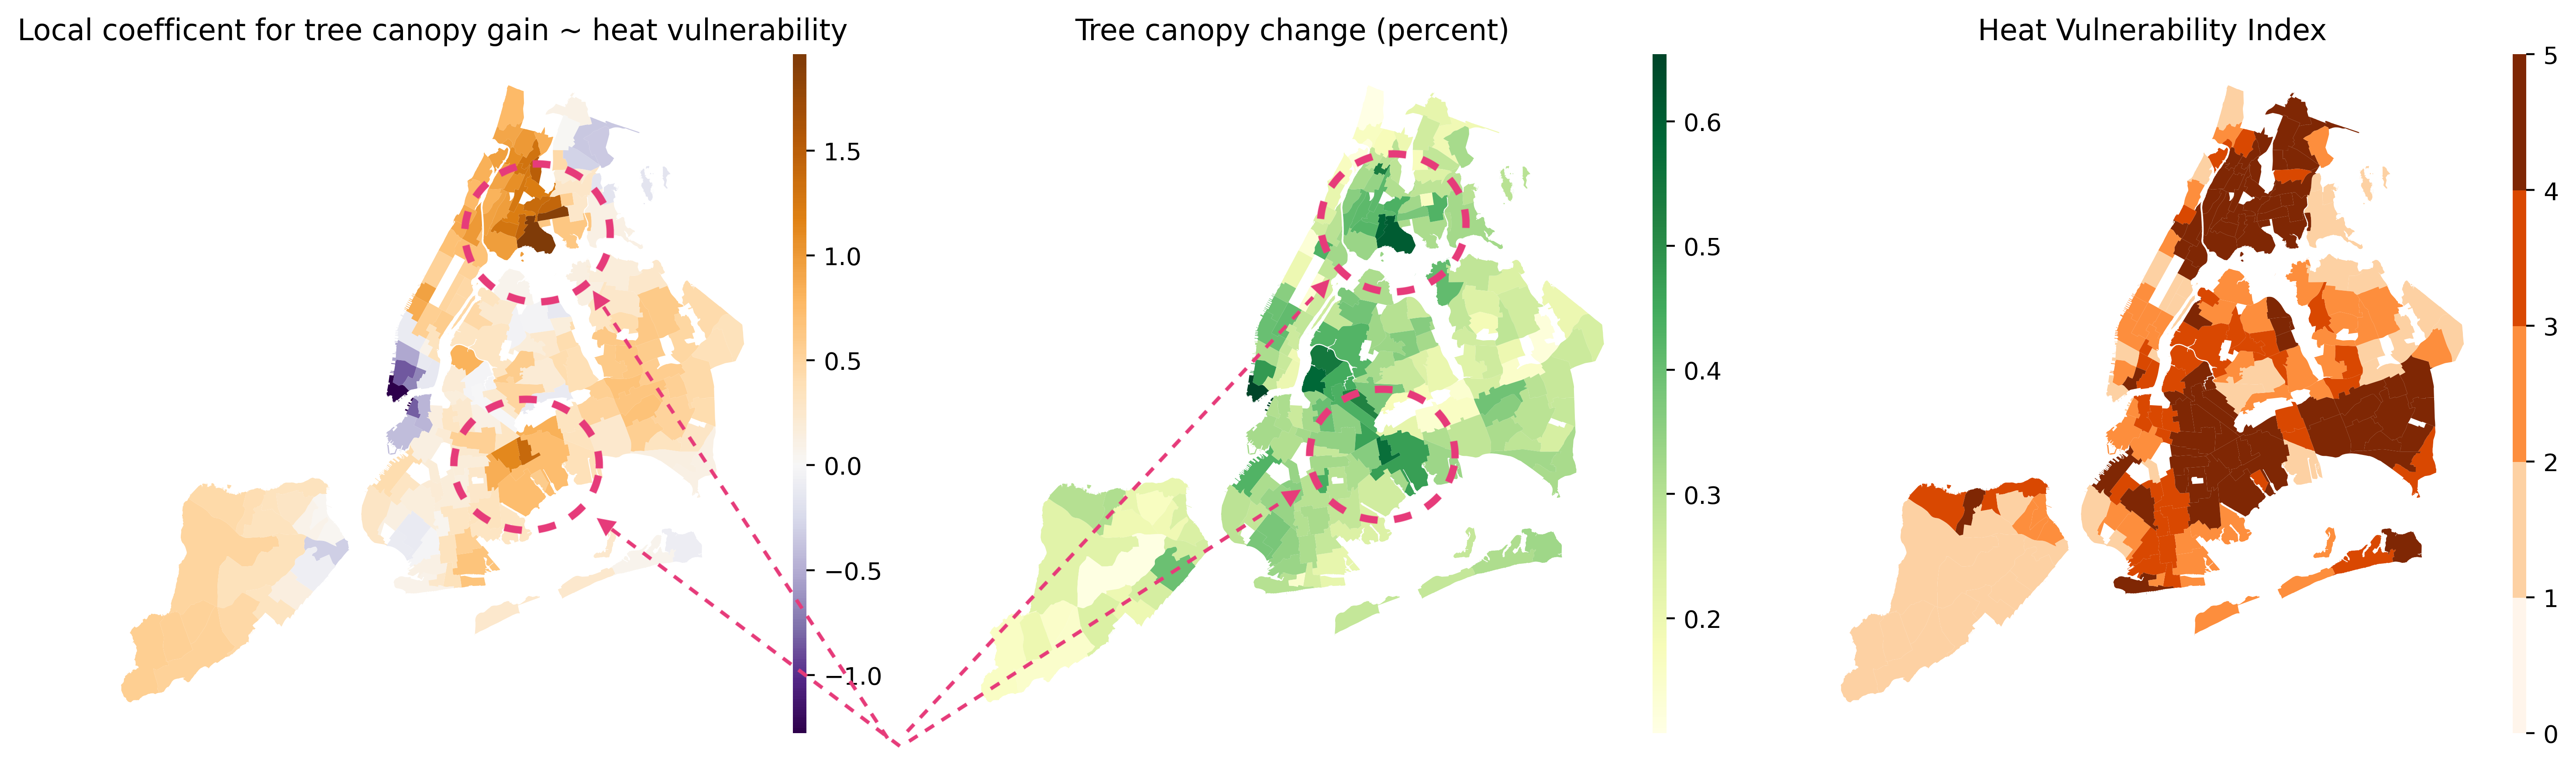
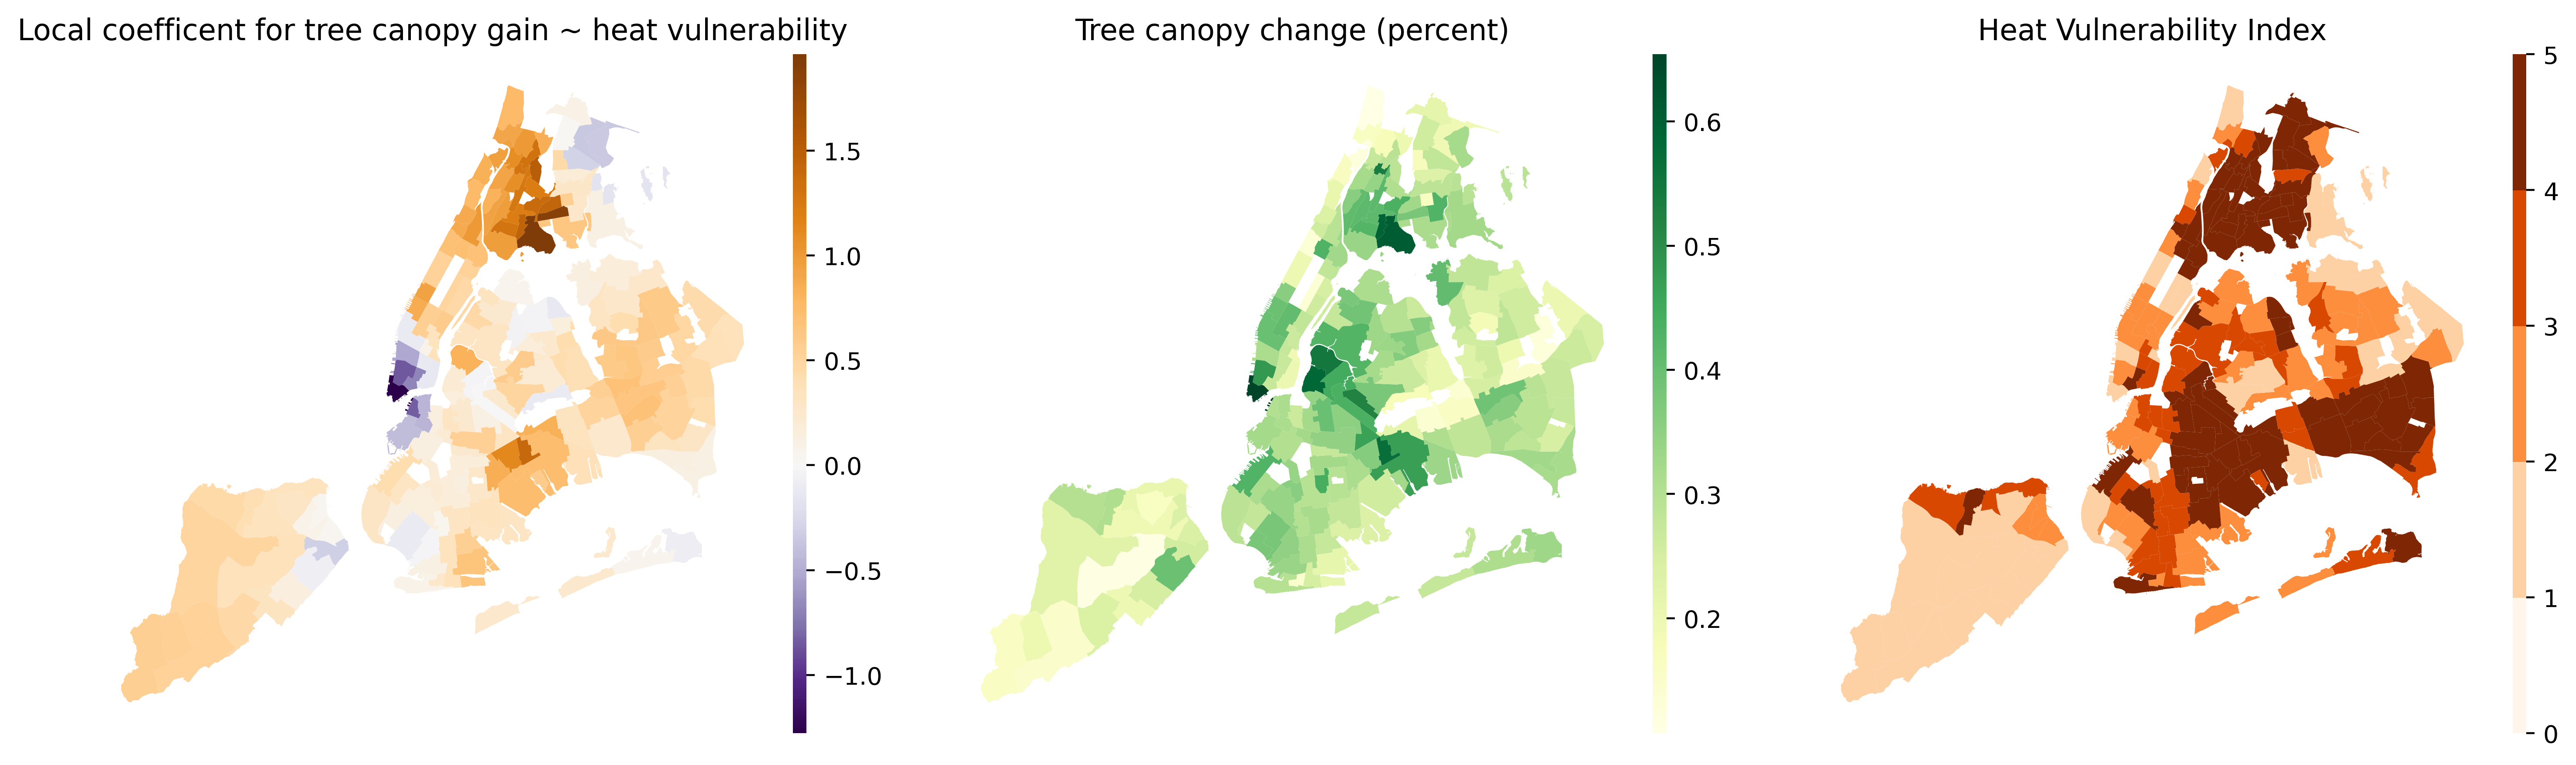
- In general, areas with greater heat vulnerability also saw the most gain in tree cover (good news!). The correlation is particularly strong in the south and central Bronx, and in parts of East New York, neighborhoods with high heat vulnerability that have seen some of the greatest gains in tree cover.
- Interestingly, the relationship is inverted in lower Manhattan, which has also seen a substantial gain in tree cover, but has low vulnerability.
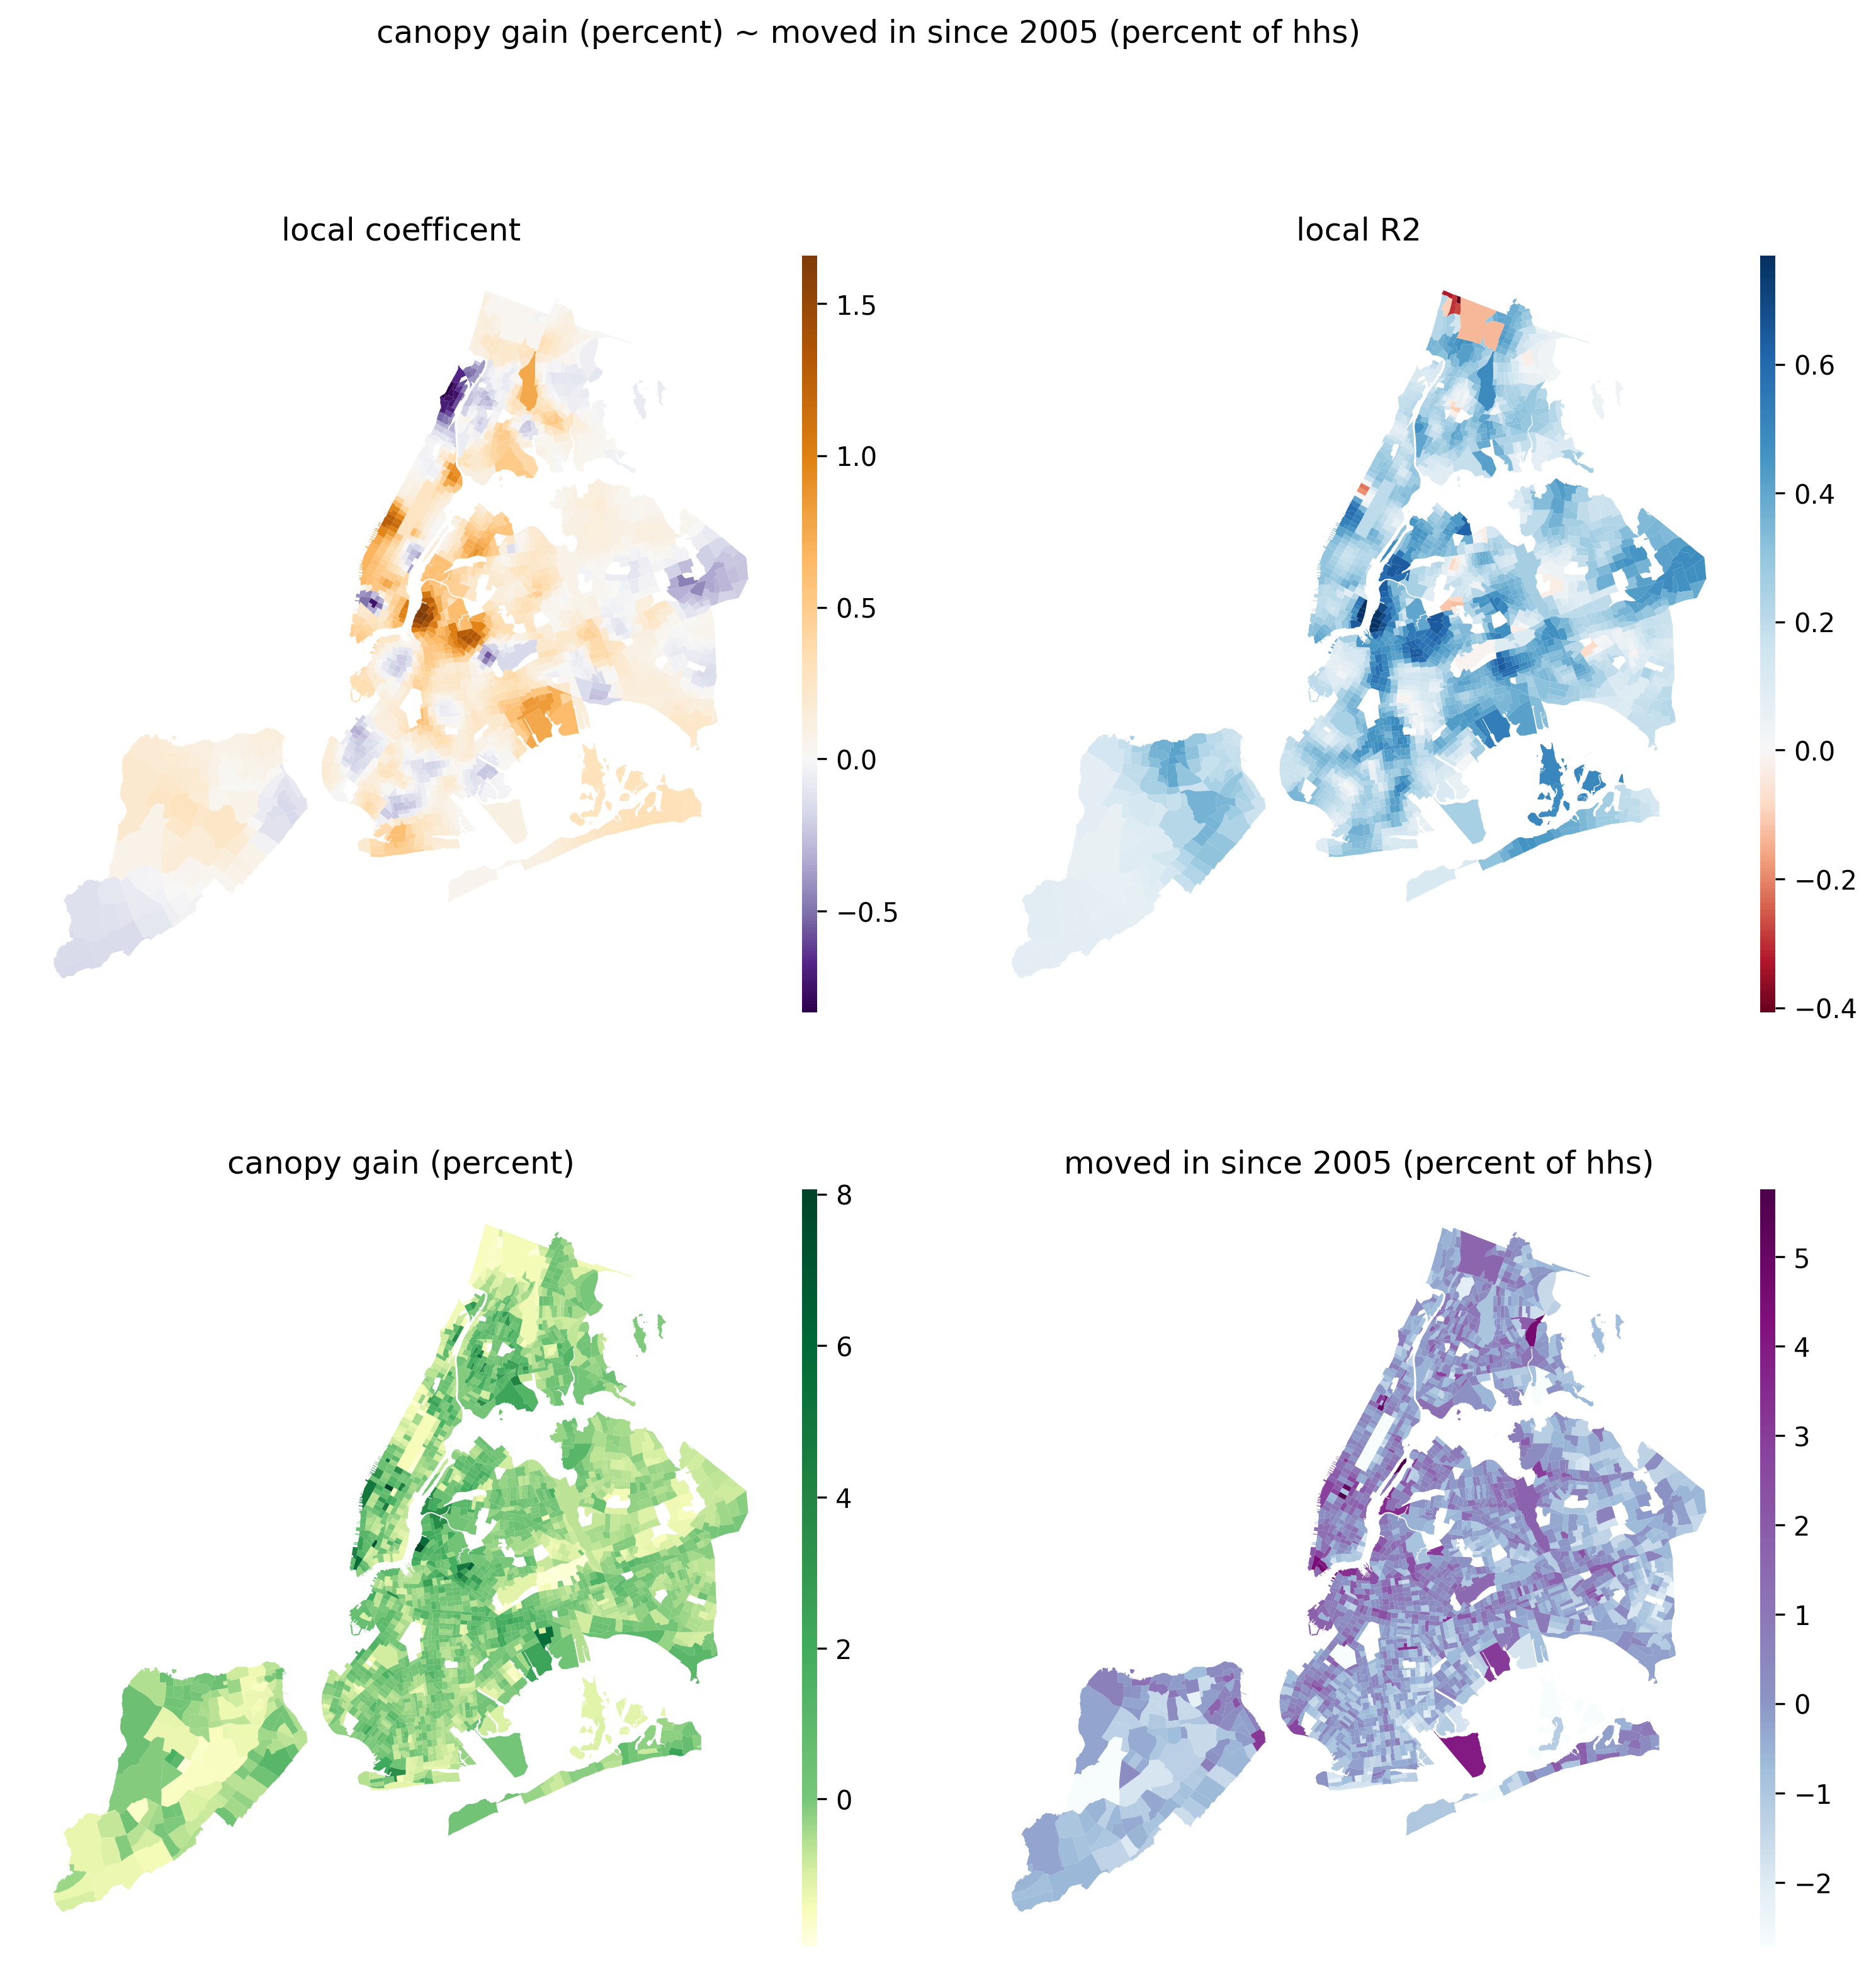
- One way to measure neighborhood change is by the portion of residents who have more recently moved into their current home. The portion of newly arrived residents is most positively associated with increased tree canopy gain in Williamsburg, Bushwick, and the middle west side of Manhattan (with an especially strong correlation near the Williamsburg waterfront). That these transforming areas have seen more tree cover could indicate that more trees are added in gentrifying areas, or that as areas are converted from industrial to residential zones, tree canopy is increased.
Nitty gritty
Check out the code notebooks and full technical report here.
Skills
- Python pipeline to process LiDAR data and join demographic and economic indicators
- testing and mapping relationships with geographically weighted regression
- computing forest connectedness using fractal dimension